
Jason Moore Apr 5, 2022 6:40:44 PM
What is the best way to understand the real value of your leads? Whether you provide roof replacements, solar systems, kitchen remodeling, or other interior or exterior renovations, let’s take a shallow dive into the numbers that truly account for the value and performance of your leads and various lead sources. A CPL (Cost Per Lead) analysis fails to account for the actual performance of leads, the effectiveness of your appointment setting process, and the rate at which you close those appointments into customers.
Lead Sources
For contractors servicing residential homeowners, let’s take a look at some of the most common lead sources and the costs associated with them.
Lead Aggregators
The most popular lead aggregator for roofing contractors is HomeAdvisor and there are several others you may be familiar with like Modernize, Porch, Angie’s List, and Houzz. With HomeAdvisor, contractors pay an annual fee and then pay from $15 to $50 per lead. In some markets, the cost per lead is more like $80 to $100. In both cases, these leads are not exclusive. They are sold to multiple competing contractors in the same markets. I’ve heard reports that these leads are sold and distributed to as many as 5 different contractors. Each contractor is in a race to be the first caller to confirm an appointment with the homeowner and this shared lead market creates a very competitive environment for winning the deal.
Canvassing
Some of the most successful sales organizations utilize canvassing to generate leads. In fact, some of the biggest rely almost entirely on leads generated from D2D canvassing efforts. The cost per lead from canvassing is a little more complicated to calculate and will include salaries, commissions, bonuses, and prizes for canvassers as well as costs for software, marketing collateral, and even transportation.
Direct Mail
Homeowners’ mailboxes used to be inundated with junk mail. Since the dawn of email marketing, the quantity of direct mail sent for advertising, like postcards and letters, has actually decreased. This has caused home services contractors to take a step back in time and revisit this marketing channel. We estimate that leads generated from direct marketing cost about $50 on average, however, this cost only accounts for the mail piece and postage using an Every Door Direct Mail campaign. More sophisticated strategies that target homeowners using data analysis will have a higher cost per lead when you take into account the price of data and the services of a data science company. Even though the cost per lead will be higher, a more targeted approach will yield more profit because you won’t waste money advertising to the wrong people and the leads you generate will close at a much higher rate. This scenario is a perfect example of why you should be calculating CPA (Cost Per Acquisition) because it measures the real value of leads that may cost more per lead but that perform substantially better than other cheaper leads.
Cost Per Acquisition
I’m pretty sure that you can already see where we are heading in this article. Not all leads are the same. Depending on the strategy, the channel, and the vendor, leads will all perform differently. The question I am about to answer is: How effectively do your leads convert into a customer? Cost Per Acquisition is a much better metric of value and can easily be measured using our CPA Calculator.
Campaign Cost
Whether you are buying leads or sending direct mail, the cost per lead is easy to determine. For canvassing, as mentioned above, it can be a little more complicated to calculate. If you are a larger organization that is managing a more complex in-house marketing strategy, you are probably setting a marketing budget for individual campaigns like Paid Social, Local SEO, Pay Per Click, and Email Marketing.
Leads Per Month
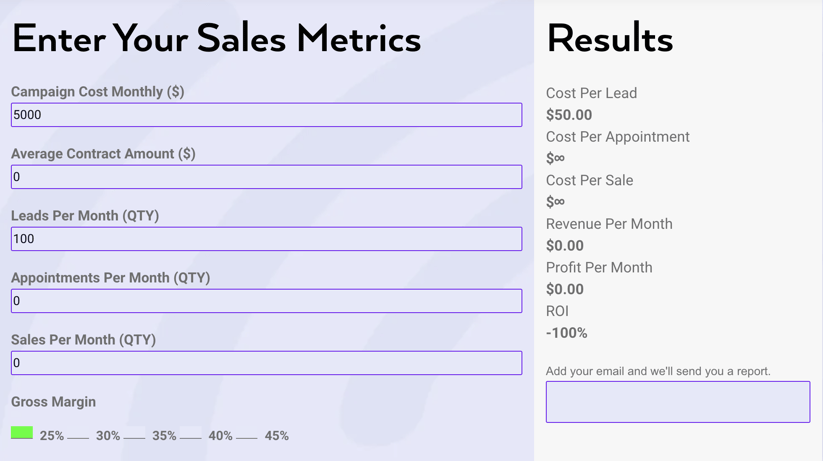
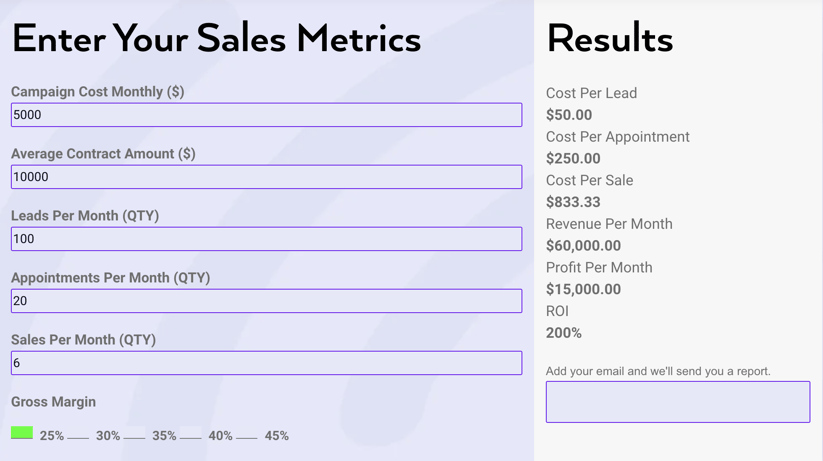
Go ahead and look up your monthly budget for a specific campaign for one of your marketing channels and determine how many leads are generated during that time. For example, if you are spending $5,000 per month for Pay Per Click and it is generating 100 leads per month, your CPL (Cost Per Lead) is $50.
If you are buying leads from an aggregator like HomeAdvisor, the Cost Per Lead isn’t completely straight forward. Different tiers of leads are available. Aged leads may be for sale at a lower price and you’ll also need to figure in your annual listing fee. If you are buying leads at different tiers, you may want to analyze the CPA for each tier, which will help you determine if the performance of aged leads is beneficial to your business or a complete waste of time. Let’s get started with this calculator example and keep it simple by assuming 100 leads per month with a campaign cost of $5000 monthly.
Appointments Per Month
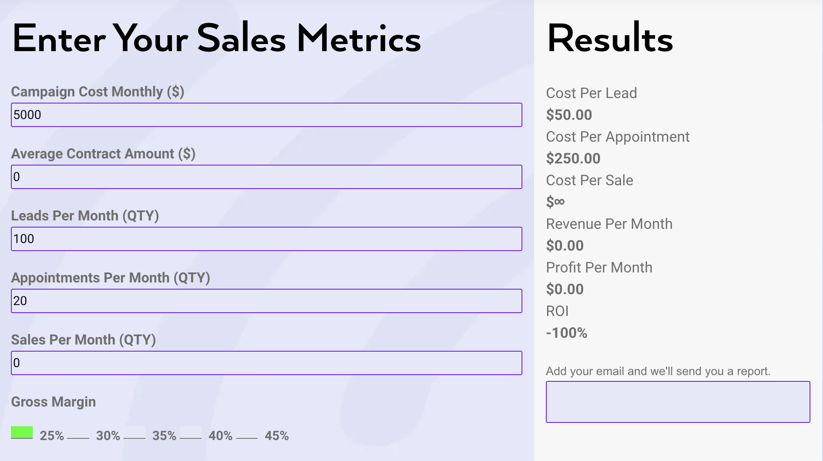
Now, how many of those leads confirmed and completed an appointment? The rate at which marketing teams or call centers convert those leads into an appointment can vary widely based on the level of persistence and followup. Especially because it can take many calls and emails, or even text messages to confirm an appointment with the homeowner. Successful appointment setting is heavily impacted by the quality of the lead. And for in-house marketing efforts, it will be the quality of the audience that matters, which will depend on what kind of targeting has been used to identify potential leads to whom your ads are shown. From these 100 leads, an effective appointment setting process would confirm 20 appointments.
Sales Per Month
The next step is to look up how many of these appointments converted into a sale. A highly targeted strategy that incorporates technology, automated processes, and highly trained sales reps can reach a 40-45% close rate and in some exceptional cases, go even higher. For our purposes today, I’ll use the common roofing industry closing rate of 30%. This means that 30% of our 20 appointments results in 6 sales per month.
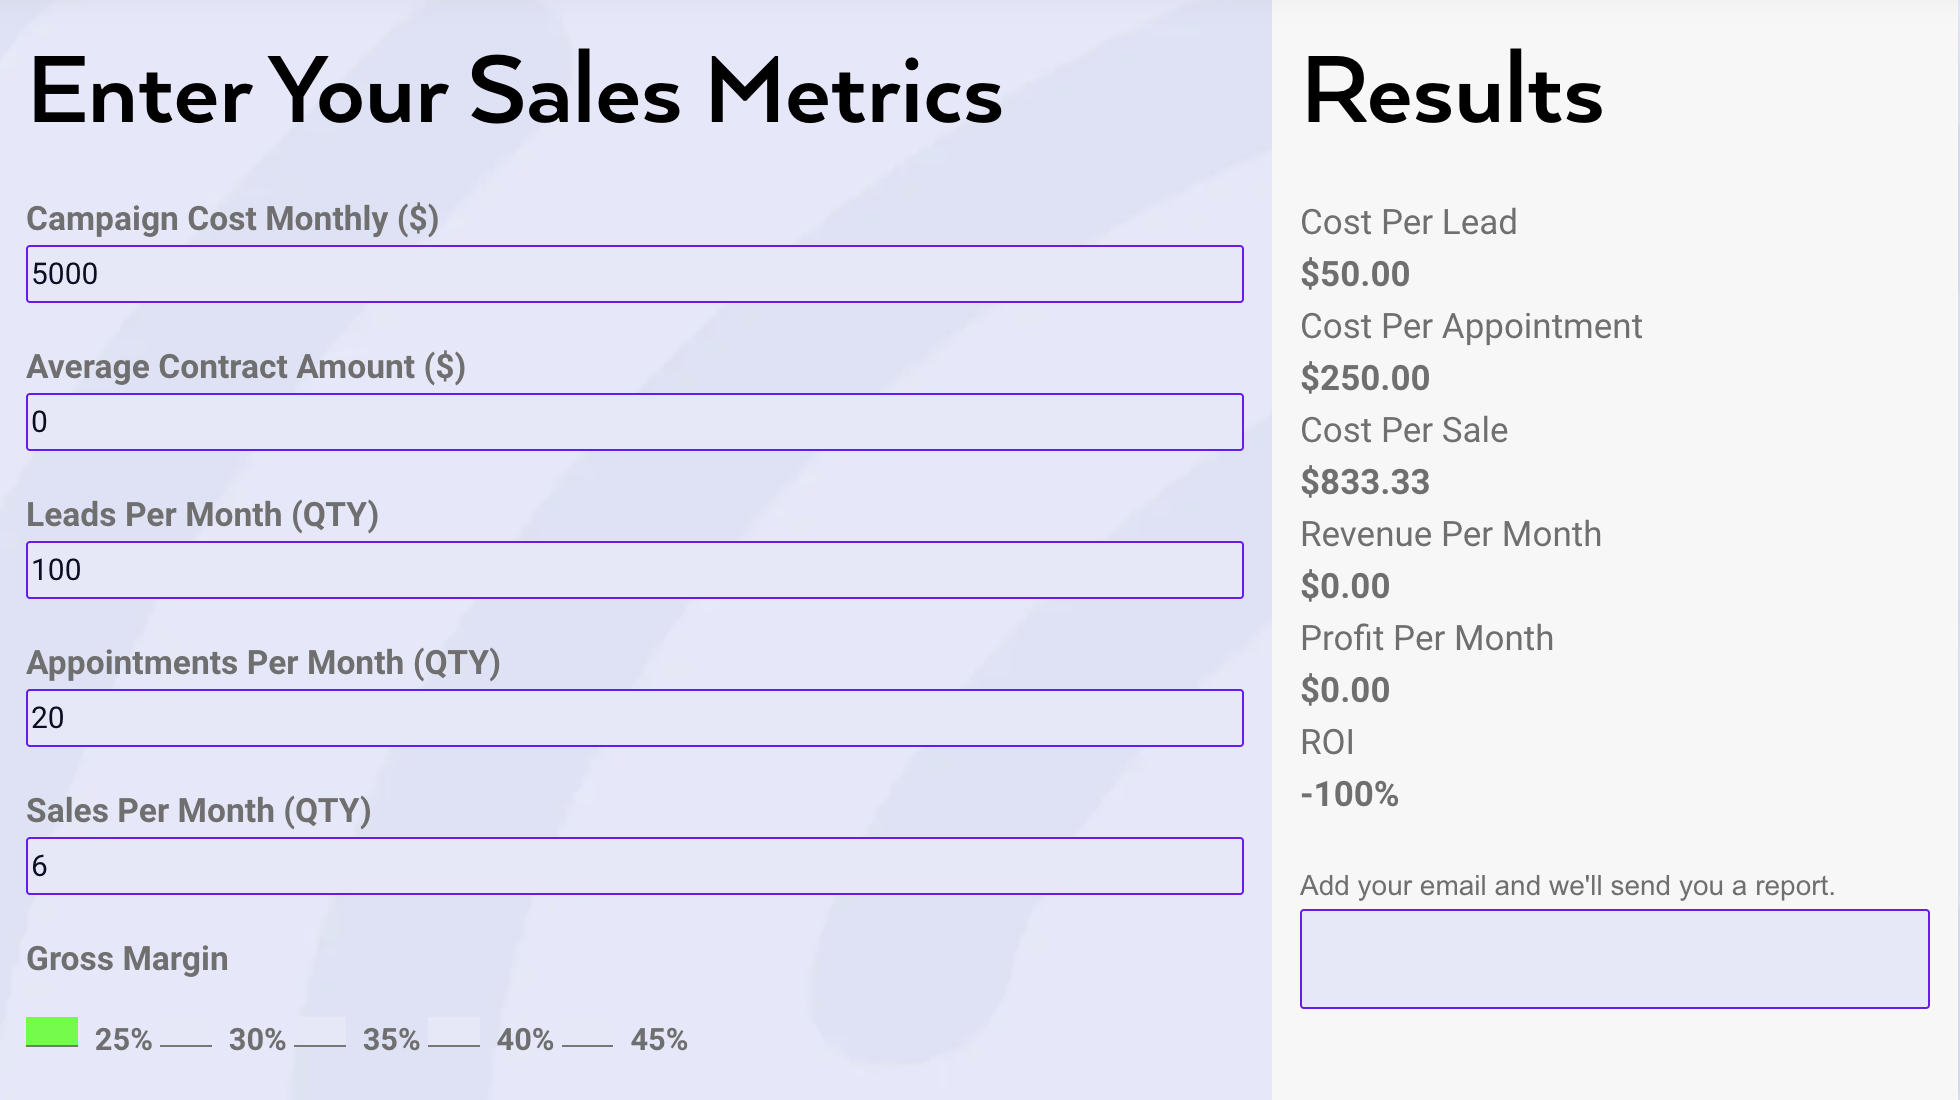
The Cost Per Acquisition for these sales or simply the Cost Per Sale comes out to $833.33. Is this a good value? Well that depends on your average contract amount and your margins. We need to determine how much profit you earn on average for each job and see what kind of return you’ll get back after spending $833 per sale.
Average Contract Amount
Let’s finish out the additional fields in the calculator and determine how much revenue and profit are generated so that we can see how much ROI is realized. Again, referencing the roofing industry, we’ll use an average contract amount of $10,000. Clearly, for large markets, high-end roofing products, solar systems, and other home improvement trades, your average contract amount may be much higher than $10,000.
Gross Margin
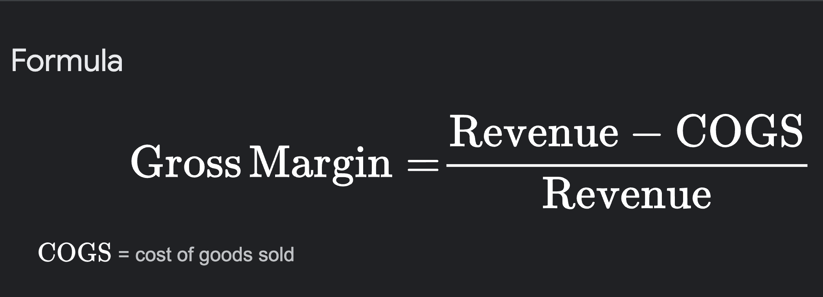
The revenue generated per month is $60,000 but what about the profit. That is going to depend on your average gross margin. I’ll be adding a new Sales Calculator next month to help you calculate your Gross Margin so be sure to subscribe to our blog. For now, here’s the formula.
I’ve consulted with hundreds of roofing contractors and I’ve noticed a few trends. First of all, some contractors conflate markup and gross margin. Please note, a 40% markup is not the same thing as a 40% Gross Margin. The next thing I have found is that the smaller roofing contractors are setting their prices too low. Roofing contractors around 1-2 MM in annual sales typically have an average GM between 25-30%. Larger roofing companies at 5MM and up are usually targeting a GM of 30-35% and some of the biggest roofing brands out there achieve anywhere from 45-55% GM or higher.
For our simple calculator example, let’s remember that it costs $5,000 to get these 6 sales. A contractor with a 25% GM is going to return $15,000 in profit. That is a 200% return on investment. Just in case you are curious, let’s look at the ROI when the GM is at 30%.

Profit has gone up to $18,000 per month and the ROI is 260%. Everything else being equal, let’s move the GM up to 35% and see where that comes out.

Nice! Profit has now peaked at $21,000 per month and ROI for this lead source is at 320%.
More ROI
One of my larger clients sells composition roofing replacements in a medium sized market and their average contract amount is $15,000 for residential homes. They maintain an average GM at 35%. Let’s crank up the contract amount to $15,000 and see what the ROI would look like for them.
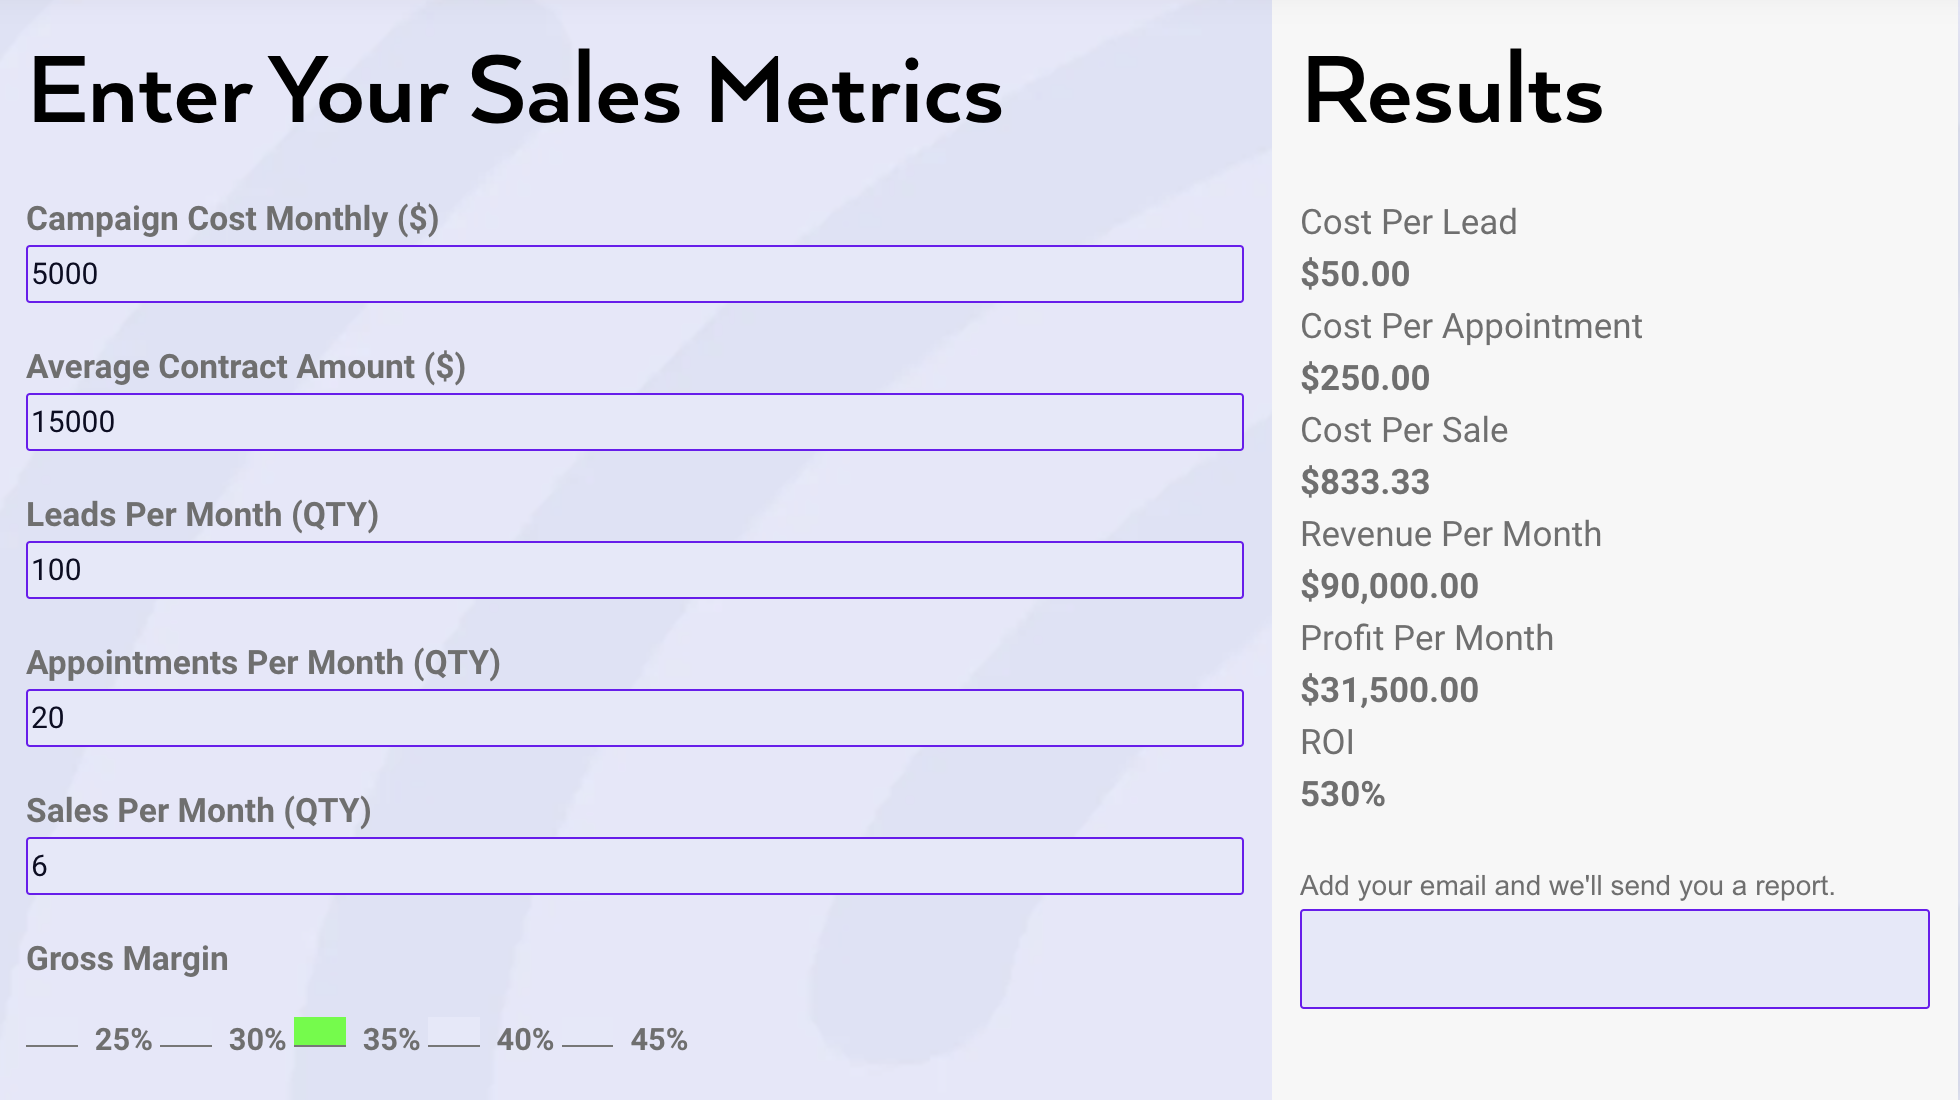
Wow! That’s a huge jump. For this hypothetical lead source, revenue per month is up to $90,000 and profit came out to $31,500, a 530% ROI.
3,140% ROI
One of the best examples I can think of to use here is from another client. They are a national roofing contractor that specializes in high-end roofing systems, mostly metal and tile. Their average contract amount is $60,000 and they maintained a 45% GM all last year. For them, leads are incredibly valuable and so they utilize multiple lead sources to drive revenue. If we plug their numbers into our calculator, the results are astounding. Let’s take a look.
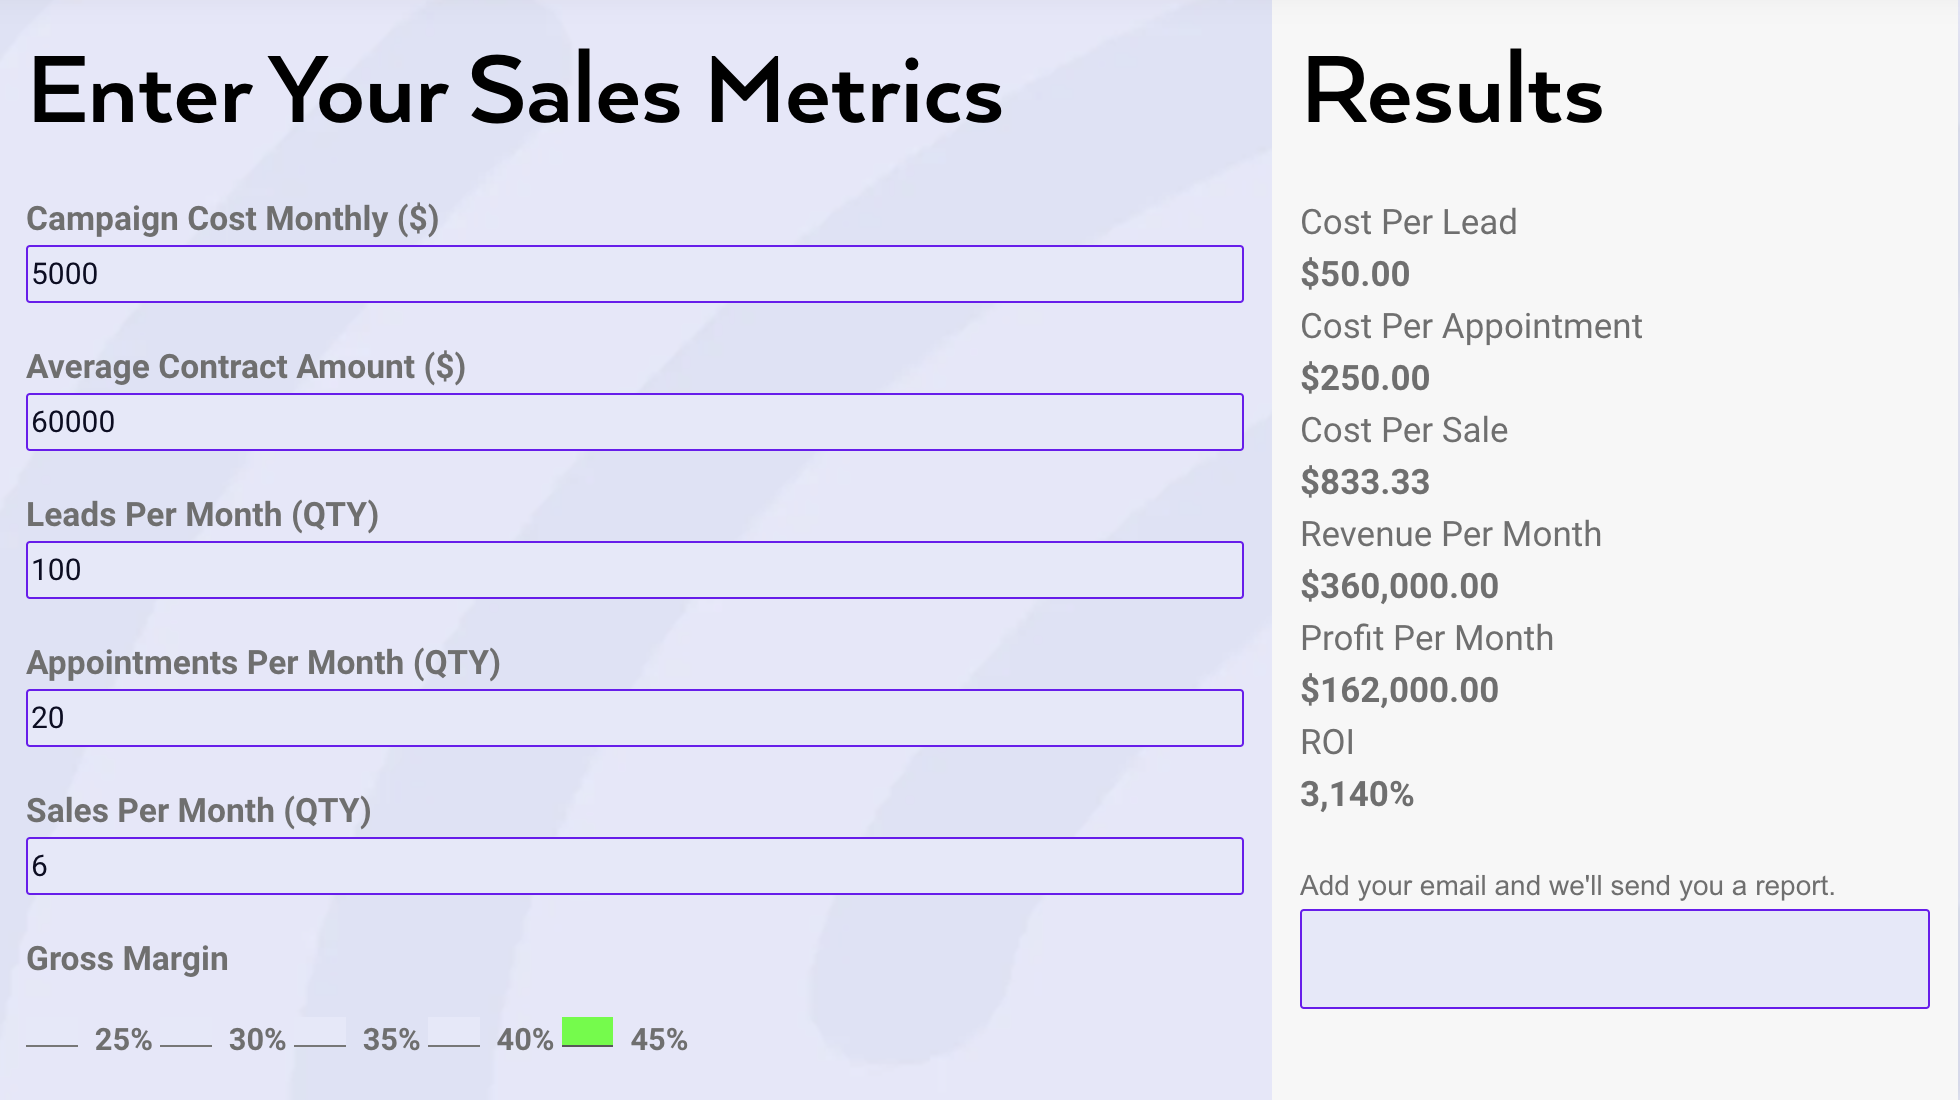
A company this size is doing well over 100MM in revenue annually so plugging their numbers into our example of 100 leads for $5000 only represents a tiny segment of their lead generation and budget. Even so, the results are pretty incredible. Off of 6 sales, they generate $360,000 in revenue, $162,000 in profit, and realize a 3,140% ROI.
What's Missing?
I just couldn’t end the article at this point. The previous paragraph is important because it can energize and motivate all of us business owners to strive towards better and better results. In reality, as your business grows, the analysis will become more complicated and more granular. Many of you reading this article are definitely thinking, “Well, what about appointments that cancel or that were never qualified to begin with? What about the occasional resident who is not the owner or when the spouse was a no show? How do we account for appointments that never had a chance? What about contract cancellations, especially in states with right to rescission laws?” And ultimately, what fails to satisfy my need for detail the most is that CPA delivers broad averages and fails to analyze the performance of individual sales reps in relation to all of the appointments that they run. For those of you who want to go deeper, be on the lookout for my next article on NSLI (Net Sales Per Lead Issued) and we’ll go into the weeds together. For now, go ahead and check out some of our other Sales Metrics Calculators.
If you are unhappy with the performance of your leads, set up a time to meet with my team at Cognitive Contractor and we can help you develop a strategy using data science and artificial intelligence that produces leads that perform at the highest level. Depending on your current strategies, I’m pretty confident that we can help you increase your appointment set rate, closing rate, retention rate, and even drive up your average contract amount by identifying the best homeowners interested in the services you provide. Get in touch with me and my team.