
Jason Moore May 11, 2022 4:21:36 PM
At Cognitive Contractor, we have a passion for data, lead generation, honest metrics, and strategies that drive growth for our clients. During our consultative process, the conversation inevitably turns toward historical performance. Some of our clients already have a solid grasp of their sales metrics and some of them find a lot of value and benefit from the use of our Sales Metrics Calculators. In previous articles, I have described and demonstrated our Lift Calculator and our CPA Calculator. LIFT helps you project future revenue growth as the quality of your leads improves. CPA shows you how much you spend to acquire a new customer on average. These metrics fail to analyze the performance of individual reps and fail to take into account several important details in the selling process. As promised, we’re about to jump into the weeds to understand the value and learn how to calculate NSLI.
Net Sales Per Lead Issued
First of all, consider calculating NSLI for your entire sales team as a whole so that you have an average to start with. Then, break it down and calculate NSLI for each individual rep. You’ll get a better understanding of your team as a whole and you will be able to accurately judge the value for each team member. To the extent that you may even consider structuring your commissions around NSLI.
In previous articles, we have discussed some of the simple metrics that are used as the building blocks to calculate LIFT and CPA. We’ll be using some of the same ones here and add a few more that weren’t accounted for previously. You may need to log in to your CRM and pull out some numbers. Grab your calculator or open up an Excel sheet if the following statistics aren’t readily available.
Building Blocks
I’m going to remain consistent here and use the same values that we used to demonstrate CPA and LIFT. Go back and check out my previous articles if you are curious why these values have been chosen.
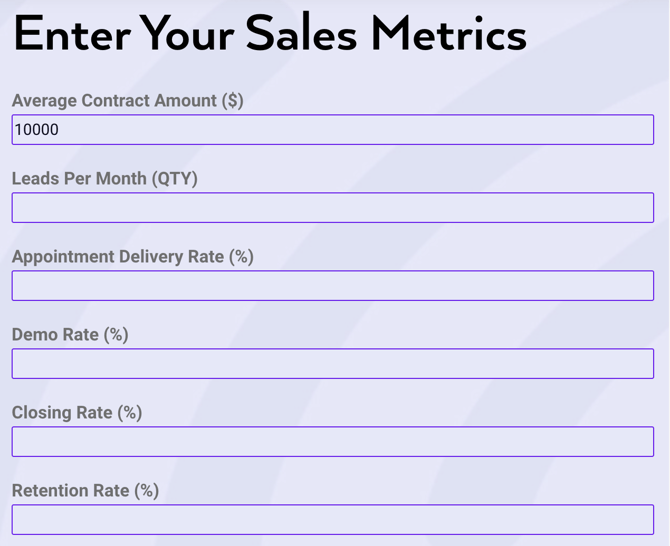
From memory, you probably know the average contract amount for your entire sales team. If your company sells multiple trades then you probably also know the average contract amount per trade. Use the team average for now. It will make sense to go back later to determine the individual average contract amount for each rep.
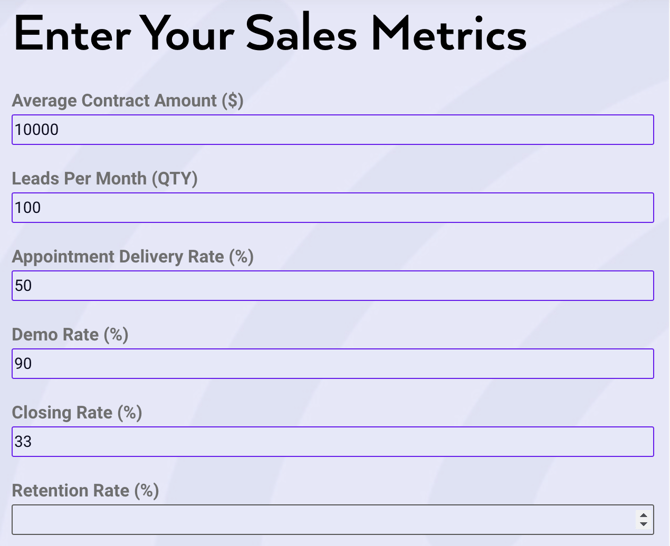
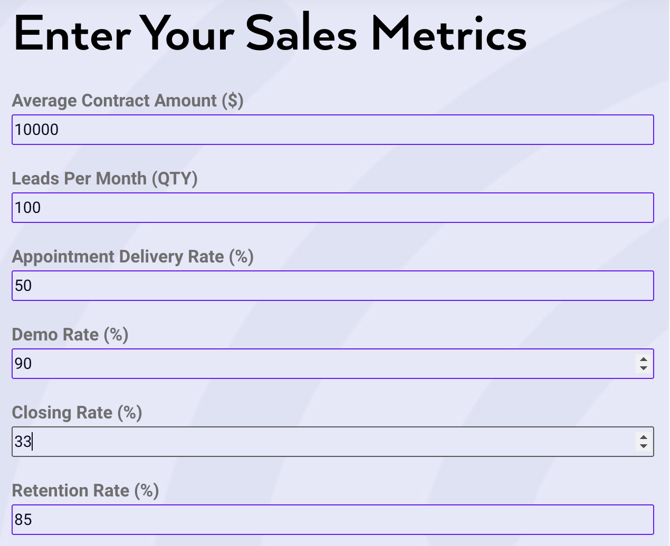
Average Contract Amount - $10,000
Leads Per Month
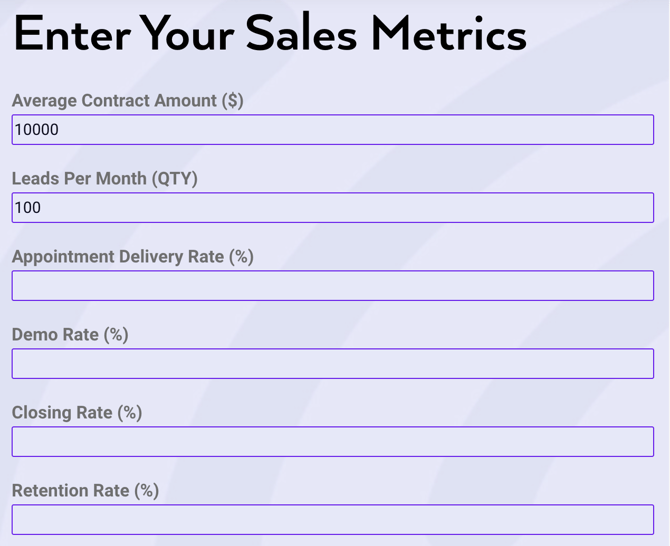
NSLI is derived from leads issued, which stems from the method where the business will acquire leads from various sources and assign those leads to their sales reps, who will then call and schedule the appointment. These days, a lot of contractors handle the appointment setting in-house and then use technology to assign the appointment to a sales rep, in many cases, adding it directly to their work calendar. Most of my contractor friends out there will understand leads issued to simply mean “leads.” Account for all of your leads regardless of the source. Include referral leads, aggregate leads, all self-gen, and any leads driven through various marketing channels.
Leads Per Month - 100
Maybe you also have dedicated D2D canvassers who generate followup appointments that you assign to your best closers. I’m certain that most of you have some local marketing that drives web leads and phone calls that you convert into appointments and then assign to your reps. And we must not forget referrals. Just make sure that your reps are entering all of their personal referral leads into your CRM so that all leads are accounted for. Remember, NSLI, in order to accurately measure performance, needs an accurate account of all leads.
Appointment Delivery Rate
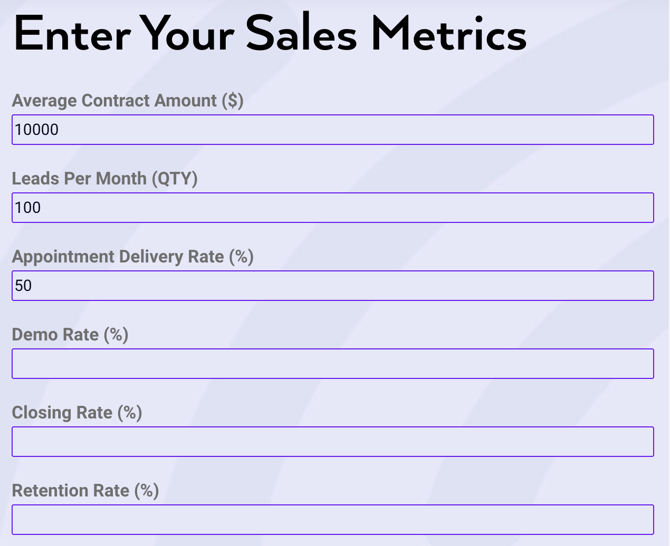
As I described above, whether you assign leads or you assign confirmed appointments, this has an impact on how you feed this calculator and build the metric. When you are setting appointments in-house, the appointment delivery rate or “set rate” will be a ratio that grades your lead quality and the performance of your call center, the people on the phones who are responsible for confirming the appointment with the homeowner. For instance, do you purchase leads from a 3rd-party lead aggregator like Home Advisor, call and schedule, and then assign them to your reps? If so, what percentage of those leads do you convert into an appointment? This is your appointment delivery rate.
For those of you who assign leads directly to your sales reps, such that they are responsible for scheduling the appointment with the homeowner, the appointment delivery rate is the ratio between the quantity of leads you assign and the quantity of confirmed appointments.
Appointment Delivery Rate - 50%
We are unique at Cognitive Contractor in that our solution not only identifies homeowners that want to buy your service, but also engages the homeowner via targeted marketing. Using our own call center and marketing automation, we convert leads at a rate of 65% into confirmed appointments with a set date and time. Then, we immediately deliver these appointments to our clients electronically, in real time.
Demo Rate
So now the appointment has been confirmed, either by the sales rep, by the call center agent, or perhaps through a 3rd-party service. The demo rate tells us how many demos occurred. Some of my contractor friends call these “sits” or refer to it as the “sit rate.” Basically, the appointment happened. There was, on some level, the opportunity for the sales rep to present, even if it is discovered early on in the appointment that the homeowner is completely disqualified.
The demo rate will account for all appointment cancellations and homeowner no-shows. It should probably not account for rep no-shows. Ideally, this is not a problem you are having with any of your reps but if so, should probably be its own metric. Regardless, in an effort to not overcomplicate this process, go ahead and include them in the appointment delivery rate calculation. Simply put, take the total number of demos and divide it by the number of appointments set.
Demo Rate - 90%

Closing Rate
I’m not going to go into detail here because we all know this one. This is the ratio of demos to deals. Most contractors define a deal as having a signed contract. In previous articles, we have used the national average for roofing contractors at 33% so let’s stick with it for this topic as well.
Closing Rate - 33%
Retention Rate
For those of you who have been following along and already read the articles pertaining to our other Sales Metric Calculators, you’ll know that retention rate is a building block that we have not utilized previously. In short, the retention rate is the ratio between contracts that cancel and contracts that do not cancel, those that turn into jobs or projects.
Retention Rate - 85%
The Key Statistic
sharvester has an interesting blog called The Church of Sales and I’ve referenced his NSLI article before. Check this out because he is a sales rep that has come to understand the value of NSLI as an important metric. He poses the difficult question that your sales reps may also ask, “How can NSLI fairly gauge my effectiveness [when] all of these situations [are] beyond my control?” He’s talking about homeowners who forget about the appointment, aren’t home, are laid off, have no credit, don’t even own the home, and in some cases, apparently have Alzheimers. These examples and many more are contributing to your demo rate, closing rate, and retention rate. But as sharvester puts it, “The same things happen to everybody at pretty much the same rate of frequency. The company can only succeed with net sales, not with nice tries.”
Incentivize NSLI
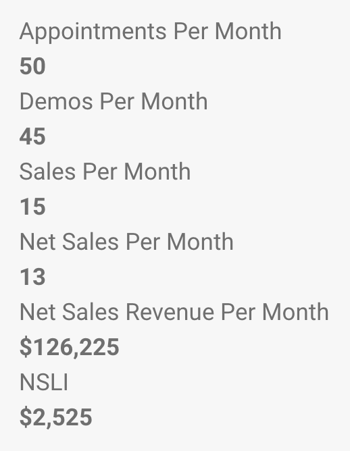
Knowing your numbers without taking action to improve those numbers is futile. My favorite aspect of this whole exercise is figuring out ways to nurture better performance. Motivate your sales reps to improve by rewarding high NSLI. sharvester gets the top bonus level when his NSLI is over $3,000 and his company expects no less than $2,000 from everyone. As you’ll see in the results below, our example NSLI comes out to $2,525.
NSLI Results
Have some fun with our calculators and learn more about your company statistics. But more importantly, take that deep dive and calculate NSLI for every sales rep and the team average. Once you have this information, you will be able to incentivize your reps and help them dial in the numbers that will lead to more sales, higher commissions, bigger bonuses, and more revenue growth, all feeding the success of your company.
Unhappy with the performance of your leads, set up a time to meet with my team at Cognitive Contractor. We can help.